Monday, November 27, 2023

Reswitching in a Model of Extensive Rent

My article with the post title is now available at the Bulletin of Political Economy (Volume 16, issue 2, pp. 133-146). The abstract follows:

Abstract: This article presents an example of the reswitching of the order of fertility and of the order of rentability. Whether or not these orders differ from one another varies with distribution for certain parameter ranges in the example. This analysis emphasizes that more rent per acre is not necessarily associated with more fertile land and that the ranking of lands by fertility cannot, in general, be determined from only data on physical inputs and outputs for the available processes.

Friday, November 24, 2023

Variations in the Economic Life of Machines

These posts demonstrate, in a model of fixed capital, that the cost-minimizing choice of the economic life of a machine need not conform to traditional Austrian and marginalist theory. The cost-minimizing choice of technique around a switch point might associate a shorter economic life of a machine with an increased capital intensity. This counter-intuitive variation of the economic life of a machine is independent of capital reversing and the re-switching of techniques, both of which are also illustrated in these posts.

These posts build on the Cambridge capital controversy (CCC). A lower rate of profits may be associated with a decreased value of capital per worker, a decreased ratio of the value of capital to output, and a decreased sustainable steady state of consumption per worker (Harcourt 1972). Capital is not a factor of production, and an equilibrium rate of profits, assuming competitive conditions, is generally not equal to the marginal product of capital (Harris 1973). The unfounded idea in the background is that, in a supply-and-demand explanation of prices and distribution, an increased relative supply of a factor of production supposedly drives its price down and incentivizes entrepreneurs to adopt techniques, out of a given technology, that use that factor more intensively. All sides to the CCC accepted that this theory lacks rigorous foundation:

"Such an unconventional behavior of the capital/output ratio is seen to be definitely possible. ... Moreover, this phenomenon can be called 'perverse' only in the sense that the conventional parables did not prepare us for it" (Samuelson 1996).

Han and Schefold (2006) and Zambelli (2018) have recently found some examples of such 'perverse' switch points, albeit not many, in empirical data obtained from national income and product accounts. Kurz (2021) raises some challenges to this empirical work.

Much of the discussion in the CCC focused on models with only circulating capital. Bidard (2004), Pasinetti (1980), and Schefold (1989) are canonical references in post Sraffian price theory to fixed capital. The economic life of a machine, in the general case of non-constant efficiency, varies with distribution. Steedman (2020) considers a model with an infinite number of alternative types of machines, each being the only basic commodity in the technique in which it used. Machines operate with constant physical efficiency, for possibly a different number of years in industry and agriculture. He finds that a machine with a shorter life can be adopted at a lower interest rate, independently of capital-reversing. In contrast, this article considers variation in the economic life of a single machine. The results established here and by Steedman can be seen as complementary.

The method of analysis is based on comparing stationary states, where prices of production prevail. These models are open, with distribution taken as exogenous. The numeric example is simple enough such that net output consists of a single consumption good, called 'corn'. Corn also functions as circulating capital, while a machine with a physical life of three years represents fixed capital. Both corn and new machines are basic commodities, in the sense of Sraffa. Although no attempt is made to represent production by a series of dated labor inputs, the economic life of the machine seems to be of interest for claims among economists developing capital theory along the lines of the Austrian school. Economists of this school have argued that a greater willingness to defer consumption leads to a greater supply of capital, a lower interest rate, and a greater period of production. In these posts, a greater period of production is identified with a longer economic life of a machine.

The application of perturbation analysis to the analysis of the choice of technique, to identify fluke cases, and to explore how switch points vary with technological change is relatively novel. A fluke case is such that almost any perturbation of model parameters disturbs its qualitative properties. Kurz and Salvadori (1995) is a classic textbook for the analysis of the choice of technique. Vienneau (2018, 2019, 2021, 2024a, and 2024b) extends this analysis to consider the effects of perturbing selected model parameters. In these posts, applying this approach to a single numeric example uncovers surprising variation in the economic life of a machine, including its non-monotonic variation with the rate of profits with neither capital-reversing nor the re-switching of techniques.

Harwick (2022) has noted that some followers of the Austrian school have recently tried to consider Austrian capital theory separately from business-cycle theory. Lewin and Cachanosky (2019) consider a financial measure of capital-intensity, namely the average duration of an investment project. Around any switch point, an increased Duration is associated with a lower interest rate. As emphasized by Fratini (2019), an increased capital intensity, in this sense, is associated with reduced net output per worker around a so-called 'perverse' switch point. Even so, any measure of capital intensity that always increases with a lower rate of profits around a switch point can be associated with a reduction in the economic life of a machine.

Capital-intensity is assessed in these posts by evaluating the price of inputs, either for a given net output or per worker. A reduction in the economic life of a machine is consistent with an increase in capital-intensity. This association between a shorter economic life and greater capital-intensity can arise around a switch point in which a smaller rate of profits results in the adoption of a more capital-intensive technique, with a consequent greater net output per worker. It can also arise around a 'perverse' switch point in which a less capital-intensive technique is adopted at a lower rate of profits. Neither type of switch point is a fluke case, as can be seen by contrasting such switch points with genuine fluke cases.

Saturday, November 18, 2023

On The Uselessness Of Economists

If you believed something different, you wouldn't be sitting where you are sitting

Suppose one wants to discuss capitalism versus socialism or some smaller matter. One might think the discipline of political economy, now known as economics would be helpful. But it is not.

What is taught in most universities in the United States was shown to be nonsense more than half a century ago. I find it hard to account for this except on the grounds of political ideology. I realize that most academic economists and their students that persist do not experience themselves as propagandists. And it does take some study to master the mathematical models, even if they are incoherent.

Obviously, exceptions exist. I am most aware of the economics departments at the University of Massachusetts at Amherst, the New School, the University of Missouri at Kansas City, and the University of Utah. And I think the situation might be different in some other countries. At least, they can list some prominent universities like the above. Furthermore, in taking courses in academic economics, one should learn something useful about how national products and income accounts are kept. Many economists might think they are doing measurement without theory, that these theoretical incoherences that I go on about do not matter to them. And there are many partial models that might be useful in a narrow context.

These sort of questions should have clear answers: For some model, what are the parameters and and what are the variables found in the solution? For each parameter or variable, what are the units of measure? Lately, I have been recommending a John Eatwell lecture on the bomb that Piero Sraffa placed at the foundations of economic theory. Working through Kurz and Salvadori's 1995 textbook is also a good way to understand my favorite devasting criticism of marginalist economics.

Smith's natural prices, Ricardo's prices of production, and Marshall's normal prices all characterize a long-period position or equilibrium, depending on the theory. Marginalist economics is about the allocation of given resources. The quantity and initial distribution of capital goods are among the givens, at least in Walras' formulation. Supply and demand are supposed to clear in all markets in equilibrium, and the capitalists obtain the same rate of profits in all markets. This model is ovedetermined and inconsistent. Walras was mistaken.

Taking the numeraire quantity of capital and its initial distribution as given was another incorrect marginalist approach. The physical composition of capital is supposed to be endogeneous. But prices of capital goods are found as solutions of the model. The quantity of capital is simultaneously inside and outside the model. Knut Wicksell realized this approach does not work. And waiting or abstinence cannot explain profits either.

So from about 1930 to the 1970s, marginalists abandoned long period theory in their most general models. The Arrow-Debreu-McKenzie model of intertemporal equilibrium is the cumulation of this trend. In the model, commodities are distinguished by physical properties, when they are available, and the state of the world. Prices are established in forward markets, found at the start of time.

This is a model of supply and demand in some sense. Households maximize utility subject to constraints. Plans are precoordinated, and all markets clear for all time. On the other hand, one can not draw well-behaved supply and demand schedules at the level of the market, as is shown by the Sonnenschein-Debreu-Mantel theorem.

Economists cannot explain how any economy would get in or approach such an equlibrium. Franklin Fisher investigated this question. Fabio Petri notes that the givens of initial quantities of capital equipment would change if production goes on while the economy is in disequilibrium. The equilibria consistent with the givens are not the equilibria that would be approached. The model does not depict tendencies in any possible capitalist economy.

Given an equilibrium, however, the forward prices embody predictions of what spot prices would be. Mainstream economics, when talking about dynamics, often mean the time paths of these spot prices. A conceptual problem arises here. If markets can open and close later, the model is not the Arrow-Debreu-McKenzie model. Anyways, the rate of profits is not the same among industries at any time period, since prices are typically not stationary.

Mainstream economists have basically given up, as I understand it, on trying to develop any general approach to explaining prices and distribution in a capitalist economy. I think the textbooks are not clear on this point. I like some of the bits of mathematics, such as game theory, in some of these textbooks.

Why study this stuff? Even though academic economists are mostly trapped in an intellectual ghetto, they still have a connection to what ideas are hegemonic. And the disciple of economics provides a puzzle for the sociology of 'knowledge' and the philosophy of science. If academic economists were merely useless, the world would be improved.

Monday, November 13, 2023

How To Find Fluke Switch Points

Figure 1: Convergence of Newton Method

This post steps through an algorithm for finding a fluke switch point. I used a different example when I tried to explain this before. Today, I use an example building on my draft ROPE Article.

Consider Figure 3 in this post, repeated below as Figure 2. Let s1 = s2 = 1. I want to find s3, the markup in the corn industry, such that the wage curves for Gamma, Delta, Eta, and Theta intersect at a single switch point. One wants to find a function one of whose zeros is the desired markup.

Figure 2: Variation of Switch Points with the Markup in the Corn Industry

This economy produces a single consumption good, called corn. Corn is also a capital good, that is, a produced commodity used in the production of other commodities. In fact, iron, steel, and corn are capital goods in this example. So three industries exist. One produces iron, another produces steel, and the last produces corn. Two processes exist in each industry for producing the output of that industry. Each process exhibits Constant Returns to Scale (CRS) and is characterized by coefficients of production. Coefficients of production (Table 1) specify the physical quantities of inputs required to produce a unit output in the specified industry. All processes require a year to complete, and the inputs of iron, steel, and corn are all consumed over the year in providing their services so as to yield output at the end of the year.

Table 1: The Technology
InputIron
Industry
Steel
Industry
Corn
Industry
abcdef
Labor1/31/105/27/2013/2
Iron1/62/51/2001/10010
Steel1/2001/4001/43/1001/4
Corn1/3001/3001/300000

A technique consists of a process in each industry. Table 2 specifies the eight techniques that can be formed from the processes specified by the technology. If you work through this example, you will find that to produce a net output of one bushel corn, inputs of iron, steel, and corn all need to be produced to reproduce the capital goods used up in producing that bushel.

Table 2: Techniques
TechniqueProcesses
Alphaa, c, e
Betaa, c, f
Gammaa, d, e
Deltaa, d, f
Epsilonb, c, e
Zetab, c, f
Etab, d, e
Thetab, d, f

Given the markups s1, s2, and s3, the wage and prices under Gamma are rational functions of the scale factor for the rate of profits:

wγ(r) = (f3 r3 + f2 r2 + f1 r + f0)/(g2 r2 + g1 r + g0)
pγ,1(r) = (u2 r2 + u1 r + u0)/(g2 r2 + g1 r + g0)
pγ,2(r) = (v2 r2 + v1 r + v0)/(g2 r2 + g1 r + g0)

Since corn is the numeraire, its price is unity. The coefficients of the polynomials are functions of the coefficients of production for the first, second, and first processes in the iron, steel, and corn industries, respectively, and of the markups.

The Delta technique differs from Gamma in the process for producing corn. The extra profits obtained in operating the second corn-producing process at Gamma prices are:

h1(r)/(g2 r2 + g1 r + g0) = 1
- [(af,1,3 pγ,1(r) + af,2,3 pγ,2(r) + af,3,3)(1 + s3r)
+ af,0,3 wγ(r)]

A switch point between Gamma and Delta is found as an appropriate zero of h1(r), which is a cubic polynomial. Denote r1(s3) as the zero sought for the fluke case.

The extra profits obtained in operating the second iron-producing process at Gamma prices are:

h2(r)/(g2 r2 + g1 r + g0) = pγ,1(r)
- [(ab,1,1 pγ,1(r) + ab,2,1 pγ,2(r) + ab,3,1)(1 + s1r)
+ ab,0,1 wγ(r)]

An appropriate zero of h2(r) is a switch point between Gamma and Eta. Denote r2(s3) as the zero sought for the fluke case.

Consider the following function:

h(s3) = r2(s3) - r1(s3)

A zero of h(s3) is such that the wage curves for Gamma, Delta, Eta, and Theta intersect at a single switch point. At a switch point for Gamma, Delta, and Eta, neither extra profits nor extra costs will be obtained in operating either iron-producing and corn-producing processes. Since the same steel-producing process is operated in all four techniques, Theta is also cost-minimizing at this switch point.

One can find such a zero by applying Newton’s method to two initial guesses, as illustrated in Figure 1 at the top of the post. Some experimentation allows one to determine two initial guesses, s03 and s13, for the markup in the corn industry and for which roots of the cubics are wanted. The slope of a linear approximation to the function whose zero is sought is:

mi + 2 = [h(si3) - h(si + 13)]/(si3 - si + 13), i = 0, 1, 2, ...

The intercept with the ordinate is:

bi + 2 = h(si + 13 - mi + 2 si + 13, i = 0, 1, 2, ...

The next iteration is:

si + 23 = - bi + 2/mi + 2, i = 0, 1, 2, ...

In my experience, Newton's method converges fairly rapidly in this application of finding fluke switch points.

Thursday, November 09, 2023

"Deserves got nothing to do with it"

This post echos another quotation from somebody who understands something about how rewards are distributed under capitalism.

"In every other country capitalism, competitive and monopolistic, displays the same defects and applies similar political and economic remedies in order to save its life from the new revolutionary attacks of socialism and communism. Regarded more narrowly from my own standpoint of criticism, what has occurred is a display and condemnation of the unequal and unfair character of all markets. For nowhere are the bargaining powers of supply and demand on an equal footing, and everywhere the individual buyers and sellers, whether of goods or services, are so unequal in their 'need' to sell and buy that the advantage accruing from sales at any given price give widely different advantages to those who participate. In other words, whether under monopoly or so-called competitive conditions, markets are intrinsically unfair modes of distribution.

This is my most destructive heresy, and therefore the one for which I have least succeeded in gaining attention, even in the form of hostile criticism, from the orthodox economists. The defence of capitalism consists mainly in ignoring positive attacks and in concentrating upon the errors, follies, and divided counsels of its assailants. Among the business and professional classes and their economic supporters the conviction holds that any property or income legally acquired represents the productive services rendered by its recipient, either in the way of skilled brain or hand work, thrift, risks, or enterprise, or as inheritance from one who has thus earned it. The notion that any such property or income can contain any payment which is excessive, or the product of superior bargaining power, never enters their minds. Writers to The Times, protesting against a rise in the Income Tax, always speak of their 'right' to the income they have 'made,' and regard any tax as a grudging concession to the needs of an outsider, the State.

So long as this belief prevails all serious attempts by a democracy to set the production and distribution of income upon an equitable footing will continue to be met by the organized resistance of the owning classes, which, if they lose control of the political machinery, will not hesitate to turn to other methods of protecting their 'rights.'" -- J. A. Hobson, Confessions of an Economic Heretic

Saturday, November 04, 2023

Variation With Markups Of The Analysis Of The Choice Of Technique With Intensive Rent

Figure 1: Variation of the Technique with Markup in Agriculture

This post is a continuation a of a previous example.

I suppose this is the first example in post Sraffian price theory which combines intensive rent and markup pricing. I do not plan on trying to publish it, in a stand-alone article. D'Agata (1983) sets some coefficients to zero to simplify it for his purposes. I would like a range of parameters where I get reswitching or capital-reversing. I have found a case where, given the wage, the cost-minimizing technique is not unique away from switch points. I would like an example where some of the locii in Figure 2 below intersect.

I might as well repeat the data. Table 1 shows the coefficients of production. Only one type of land exists, and three processes are known for producing corn on it. Following D'Agata, assume that one hundred acres of land are available and that net output consists of 90 tons iron, 60 tons steel, and 19 bushels corn. The net output is also the numeraire.

Table 1: The Coefficients of Production
InputIndustry
IronSteelCorn
IIIIIIIVV
Labor11111/51
Land00111
Iron001/101/101/10
Steel002/51/101/10
Corn1/103/51/103/102/5

All three commodities must be produced for any composition of net output. Table 2 lists the available techniques. Only Alpha, Delta, and Epsilon are feasible for these requirements for use. Not all land is farmed and only one corn-producing process is operated under Alpha. Two corn-producing processes are operated together under Delta and Epsilon.

Table 2: Techniques
TechniqueProcesses
AlphaI, II, III
BetaI, II, IV
GammaI, II, V
DeltaI, II, III, IV
EpsilonI, II, III, V
ZetaI, II, IV, V

In the non-competitive case, the relative markups in different industries are taken as given. Let the rates of profits be in proportions of s1, s2, and s3, respectively.

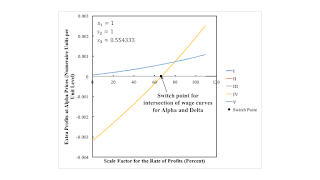
Figure 1, at the top of the post, shows the variation in the analysis of the cost-minimizing technique with perturbations of the markup up in agriculture. In drawing this figure, markups in iron and corn production, s1 and s2, are assumed unity. At the intersection between the Alpha and Delta wage curves, the rent for Delta is zero. The scale factor at this switch point is the maximum for the Delta technique. At a switch point between Alpha and Epsilon in regions 1, 2, 3, and 4, the rent for epsilon is zero. The scale factor at such a switch point is the maximum scale factor for Epsilon. In regions 5 and 6, the maximum scale factor for Epsilon is the scale factor for which the wage turns negative.

A fluke case exists off to the right where the wage curves for Alpha at Delta intersect at the maximum scale factor for the rate of profits for Alpha. At that switch point, Delta has a scale factor for the rate of profits of zero percent and a rent of zero. The fluke case partitioning regions 2 and 3 is one where the wage curves for Alpha and Epsilon intersect at the scale factor where the wage for Delta first turns positive. The fluke case partitioning regions 3 and 4 is one in which the wage curves for Alpha, Delta, and Epsilon all intersect at a single switch point.

The fluke cases partition regions 4 & 5 and 5 & 6 change some characteristics of the range of the scale factor of the rate of profits in which no cost-minimizing technique exists. At the fluke case partitioning regions 4 and 5, the wage curves for Alpha and Epsilon intersect at the maximum scale factor for Alpha. I have previously provided an analysis of the fluke case dividing regions 5 and 6. Maybe I should not consider these two fluke cases since they arise, in some sense, for switch points off the frontier.

Anyways, Table 2 shows how the analysis of the choice of technique varies among the numbered regions. If wants to look at these results in some detail, one can relate the variation in the analysis of the choice of technique to the fluke cases.

Table 2: The Cost-Minimizing Technique in Selected Regions in Parameter Space
RegionRange for Scale FactorCost-Minimizing Techniques
10 ≤ rR*,εEpsilon
R*,εrRαAlpha
20 ≤ rR*,εEpsilon
R*,εrRδAlpha
RδrR*,δAlpha and Delta
R*,δr < RαNone. Wage for Alpha positive.
30 ≤ rRδEpsilon
RδrR*,εDelta and Epsilon
R*,εrR*,δAlpha and Delta
R*,δr < RαNone. Wage for Alpha positive.
40 ≤ rRδEpsilon
Rδrr*Delta and Epsilon
r*rR*,δNone. Wage for Alpha, Delta, Epsilon positive. Rent for Delta and Epsilon positive.
R*,δr < R*,εNone. Wage for Alpha and Epsilon positive. Rent for Epsilon positive.
R*,εr < RαNone. Wage for Alpha positive.
50 ≤ rRδEpsilon
Rδrr*Delta and Epsilon
r*rR*,δNone. Wage for Alpha, Delta, Epsilon positive. Rent for Delta and Epsilon positive.
R*,δrRεNone. Wage for Alpha, Epsilon positive. Rent for Epsilon positive.
Rεr < RαNone. Wage for Alpha positive.
60 ≤ rRδEpsilon
Rδrr*Delta and Epsilon
r*rRεNone. Wage for Alpha, Delta, Epsilon positive. Rent for Delta and Epsilon positive.
RεrR*,δNone. Wage for Alpha, Delta, positive. Rent for Delta positive.
R*,δr < RαNone. Wage for Alpha positive.

Figure 2, for completeness, illustrates the partition of the parameter space of markups, where the ratios of markups in iron and steel need not be the same. Figure 1 illustrates what happens along a vertical line in Figure 2 at s2/s1 is unity. I realize it is hard to see region 4 and to distinguish its boundaries in Figure 2.

Figure 2: Partition Of Parameter Space

I do not draw any great conclusions. This example demonstrates my visualization techniques and perturbation analysis can be applied to an example where the cost-mninimizing technique is not found from a frontier of wage curves. The non-uniqueness and non-existence of a cost-minimizing technique arises in D'Agata's original example.

Wednesday, November 01, 2023

An Alpha Vs. Delta Pattern For The r-Order Of Fertility With Intensive Rent And Markup Pricing

Figure 1: Wage Curves and Rent for an Example of Intensive Rent

This post is a continuation of a previous example.

This is a fluke case insofar as the Alpha and Delta wage curves intersect at the scale factor for the rate of profits that is the maximum possible for the Epsilon technique. This fluke case is associated with a qualitative change in the range of the scale factor for the rate of profits in which no cost-minimizing technique exists.

The technology, endowments, requirements for use, and techniques are as previously defined. Requirements for use can only be satisfied by the Alpha, Delta, and Epsilon techniques.

I continue to consider markup pricing. The rate of profits is (s1 r), (s2 r), and (s3 r) in the iron, steel, and corn industries. In determining which technique is cost-minimizing, r, the scale factor for the rate of profits is taken as given.

Figure 1, at the top of this post, depicts the wage and rent curves for the different techniques. The wage curves for the cost-minimizing techniques lie on the wage frontier. The wage frontier consists of the wage curves for the Delta and Epsilon techniques up to the switch point between them. The wage frontier ends there. No technique is cost-minimizing between this switch point and the maximum scale factor for the rate of profits for Alpha.

Table 1 goes into more detail on the wage curves than aqnybody probably cares about. I introduce some notation that I will find useful in later posts. Rδ is the scale factor for the rate of profits at which the wage is zero for Delta. R*,δ is the scale factor for the rate of profits at which the rent is zero for Delta. This is a fluke case because R*,δ is equal to Rε. Anyways, in the first range for the scale factor, only the Alpha and Epsilon techniques have wage curves that are eligible to lie on the wage frontier; the wage curve for the Delta technique lies below the axis for the scale factor for the rate of profits. In the next two ranges, all three wage curves are eligible. In the last range of the scale factor, only the wage curve for Alpha is eligible. The rent curve for Delta and the wage curve for Epsilon lie below the axis for the scale factor.

Table 1: Cost-Minimizing Techniques
Lower Bound on rUpper Bound on rTechniques
0 percentRδAlpha has a positive wage
Delta has a negative wage
Epsilon has a positive wage and positive rent
Epsilon is uniquely cost-minimizing
Rδr*Alpha has a positive wage
Delta has a positive wage and positive rent
Epsilon has a positive wage and positive rent
Delta is non-uniquely cost-minimizing
Epsilon is non-uniquely cost-minimizing
r*R*,δAlpha has a positive wage
Delta has a positive wage and positive rent
Epsilon has a positive wage and positive rent
No cost-minimizing technique exists
R*,δRαAlpha has a positive wage
Delta has a positive wage and negative rent
Epsilon has a negative wage and positive rent
No cost-minimizing technique exists

I plot extra profits for each process for each technique to demonstrate my claims about which technique is cost-minimizing. Figure 2 shows extra profits for each process at Alpha prices. Extra profits are zero for the three processes comprising the technique. The last corn-producing process can always pay extra profits for any scale factor, while the penultimate process can pay extra profits for any scale factor greater than that at the intersection of the Alpha and Delta wage curves and not exceeding the maximum scale factor for the Alpha technique. The Alpha technique is never cost-minimizing.

Figure 2: Extra Profits with Alpha Prices

Figure 3 plots extra profits for each process for the Delta and Epsilon techniques. Since four of the five processes in the technology are operated for each technique, four of the five processes obtain extra profits of zero for all scale factors between the limits for each technique. If the Delta technique were in operation at a scale factor greater than at the switch point between Delta and Epsilon, farmers would start to operate the fifth process, moving away from the Delta technique. If the Epsilon technique were in operation in this range, farmers would start to operate the fourth technique. A market algorithm would not coverge to any technique for a scale factor for the rate of profits greater than that at the switch point between Delta and Epsilon and not exceeding the maximum scale factor for the Alpha technique.

Figure 3: Extra Profits with Delta or Epsilon Prices

For a smaller markup in agriculture than in this fluke case, three interesting ranges of the scale factor exist where no technique is cost-minimizing. In the first, the Alpha, Delta, and Epsilon techniques can all pay positive wages and non-negative rents, with positive prices. In the second, only the Alpha and Delta techniques can pay positive wages and a non-negative rent. In the third, the Alpha technique can pay a positive wage, while the Delta technique cannot pay a positive rent.

For a larger markup than in the fluke case, the second interesting range of the scale factor has changed. The Delta technique can no longer pay a positive rent. Instead, the Alpha and Epsilon techniques can pay positive wages and non-negative rents, with positive prices.