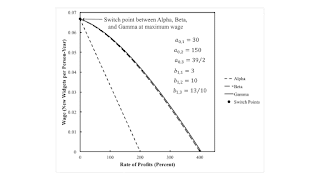
| Figure 1: Wage Frontier for a Fixed Capital Example |
This post presents a perturbation of parameters in a 'one good' model of fixed capital. The coefficients of production differ from those in this reswitching example. But the model has the same structure.
Consider a one-commodity economy in which labor and widgets are used to produce new widgets, the only consumption good. (The use of the term 'widget' to designate the single produced commodity emphasizes how unrealistic this model is.) New widgets last several years when used in producing widgets. In this particular answer to Steedman's homework assignment, they last three years. And their efficiency can vary throughout their technical lifetime. Accordingly, Tables 1 and 2 specify the coefficients of production for three processes.
| Input | Process | ||
| (I) | (II) | (III) | |
| Labor | a0,1 | a0,2 | a0,3 |
| New Widgets | 1 | 0 | 0 |
| One-Year Old Widgets | 0 | 1 | 0 |
| Two-Year Old Widgets | 0 | 0 | 1 |
| Output | Process | ||
| (I) | (II) | (III) | |
| New Widgets | b1,1 | b1,2 | b1,3 |
| One-Year Old Widgets | 1 | 0 | 0 |
| Two-Year Old Widgets | 0 | 1 | 0 |
Firms are not required to operate all three processes. They can truncate the use of widgets after one or two years. The choice of technique in this model is equivalent to the choice of the economic life of a widget. In the Alpha technique, the widget is operated for one year; in the Beta technique, it is operated for two years; and in the Gamma technique, it is operated for the full three years.
The wage frontier is the outer envelope of all wage curves. In models of circulating and fixed capital without superimposed joint production, the cost-minimizing technique, at a given rate of profits, is the technique which contributes its wage curve to the frontier at that rate. The Gamma technique is cost-minimizing in Figure 1 for all feasible rates of profits. Wage curves, when on the frontier, are declining functions of the rate of profits. At a switch point, more than one technique is cost-minimizing. At a rate of profits of zero in Figure 1, the Alpha, Beta, and Gamma techniques are all cost-minimizing.
The single switch point in Figure 1 is a fluke case several times over. It is the intersection of three wage curves, not two. And the switch point is on the wage axis, occurring for a rate of profits of zero. These properties are destroyed by any variation in certain coefficients of production. Figure 2 illustrates variations in b1,2 and b1,3. (The numbering of regions are consistent with this post.) The location in parameter space for fluke switch points, which I call patterns of switch points, is shown. Consider parameters in Region 4, and suppose b1,2 is increased. Eventually, a fluke case will arise in which the switch point between the Alpha and Beta technique is on the wage axis. When b1,2 > 10, this switch point will no longer occur for a non-negative rate of profits. It will only be cost-minimizing to run widgets for two or three years, depending on distribution. On the other hand, consider an increase in b1,3. The switch points between Alpha and Beta and between Beta and Gamma will eventually coincide, in a single switch point at a positive rate of profits. With any further increase in this parameter, it is no longer cost minimizing to run widgets for two years, whatever the distribution of income.
| Figure 2: Selected Regions in Parameter Space |
Tables 3 and 4 summarize the choice of technique in each region in Figure 2. Negative real Wicksell effects occur at all switch points in the four regions in Figure 2. According to traditional Austrian and marginalist dogma, one might expect an increase in capital intensity to go along with a longer economic life of a widget. This idea is proven to be untrue in Regions 1, 4, and 5. Is the jump over an economic life of two years in Region 1 surprising? Adjacent techniques on the wage frontier need not be near in a parameter space formed by coefficients of production. Continuity in the wage frontier does not imply continuous variation in coefficients of production. In this case, the three-technique pattern of switch points illustrates how managers of firms come to eliminate the choice of the Beta technique.
| 1 | 0 ≤ r ≤ r1 | Widgets operated for one year |
| r1 ≤ r ≤ rγ | Widgets operated for three years | |
| 3 | 0 ≤ r ≤ rγ | Widgets operated for three years |
| 4 | 0 ≤ r ≤ r1 | Widgets operated for one year |
| r1 ≤ r ≤ r2 | Widgets operated for two years | |
| r2 ≤ r ≤ rγ | Widgets operated for three years | |
| 5 | 0 ≤ r ≤ r1 | Widgets operated for two years |
| r1 ≤ r ≤ rγ | Widgets operated for three years |
| 1 | A larger rate of profits is associated with a longer economic life of a widget. |
| 3 | No switch points. |
| 4 | A larger rate of profits is associated with a longer economic life of a widget. |
| 5 | A larger rate of profits is associated with a longer economic life of a widget. |
This structure in a two-dimensional parameter space is generic, in some sense. Three partitions of patterns over the wage axis intersect in the start of a ray that is a partition for a three-technique pattern. A corresponding structure exists for patterns over the axis for the rate of profits.


